
Check out my GitHub repository for more information and source code of the project!
Project Overview
Genomics is becoming increasingly important in oncology as precision medicine is continuously being advanced. One area of genomics that oncologists pay attention to is variant classification. A variant is a specific mutation in a gene that is caused by change in nucleotide sequence. There are many types of mutations but we focused on missense mutation, which is caused by a change in a single nucleotide that results in a different amino acid being translated. Many researchers focus on these variants and their classification. A variant is either pathogenic (disease-causing) or benign (not disease-causing). This classification helps clinicians determine the correct treatment plan for their patients. Increased use of next-generation sequencing has led to the discovery of many variants of uncertain significance, which are not clearly categorized as pathogenic or benign. In order to address issues, different companies and institutions have developed in silico tools help classify these variants. However, the results tend to be different due to variation between the prediction algorithms. The purpose of this study is to evaluate the performance of seven widely-used in silico tools in identifying drug-actionable gene’s variants as pathogenic or benign in nine solid cancers.
Methods
To perform the evaluation, we first selected a list of common solid cancers (breast, ovarian, colorectal, melanoma of skin, thyroid, bladder, pancreatic, prostate, and biliary) to focus on. Each cancer type has its own NCCN guideline determined by leading physicians in the area. We determined each cancer’s genes that are actionable genetic biomarkers. We then collected pathogenicity data for variants of those genes that have already been classified from three databases: ClinVar, OncoKB, and My Cancer Genome. We took these variants and ran them through our in silico tools (PolyPhen-2 HumVar, PolyPhen-2 HumDiv, Align-GVGD, MutationTaster2021, CADD, FATHMM, and REVEL) and compared the results to the predicted value. We computed the accuracy, sensitivity specificity, positive predictive value (PPV), negative predictive value (NPV), and Matthews correlation constant (MCC) as our quantitative measure of performance. I used R to run all of the analysis and to create the visualizations.
Exploratory Data Analysis (EDA)
I first skimmed the data. As indicated by the following output, all of the resulting data from running through tools (rows 5-11) have missingness to a degree. However, the complete rates are all about 0.98, which is sufficient for analysis.
# A tibble: 11 × 4
   skim_type skim_variable n_missing complete_rate
   <chr>     <chr>             <int>         <dbl>
 1 character cancer                0         1
 2 character gene                  0         1
 3 character variant               0         1
 4 numeric   label                 0         1
 5 numeric   humdiv               24         0.992
 6 numeric   humvar               24         0.992
 7 numeric   mt2021               26         0.991
 8 numeric   align_gvgd           36         0.988
 9 numeric   revel                 3         0.999
10 numeric   cadd                  4         0.999
11 numeric   fathmm               33         0.989
Then, I looked at the distribution of pathogenic and benign variants. The first output shows us that the entire dataset consists of 46.8% pathogenic variants and 53.2% benign variants. This indicates that imbalance is not an issue when looking at the overall data. However, the second output shows us that some of the cancer types have imbalanced data.
# A tibble: 1 × 5
  count_total count_path count_ben ratio_path ratio_ben
        <int>      <dbl>     <dbl>      <dbl>     <dbl>
1        2900       1358      1542      0.468     0.532
# A tibble: 9 × 6
cancer count_total count_path count_ben ratio_path ratio_ben
<chr> <int> <dbl> <dbl> <dbl> <dbl>
1 biliary 91 57 34 0.626 0.374
2 bladder 100 63 37 0.63 0.37
3 breast 823 349 474 0.424 0.576
4 colorectal 127 99 28 0.780 0.220
5 melanoma 87 67 20 0.770 0.230
6 ovarian 706 259 447 0.367 0.633
7 pancreas 457 211 246 0.462 0.538
8 prostate 454 210 244 0.463 0.537
9 thyroid 55 43 12 0.782 0.218I plotted the number of variants in each cancer type and indicated the ratio of benign and pathogenic variants with color.
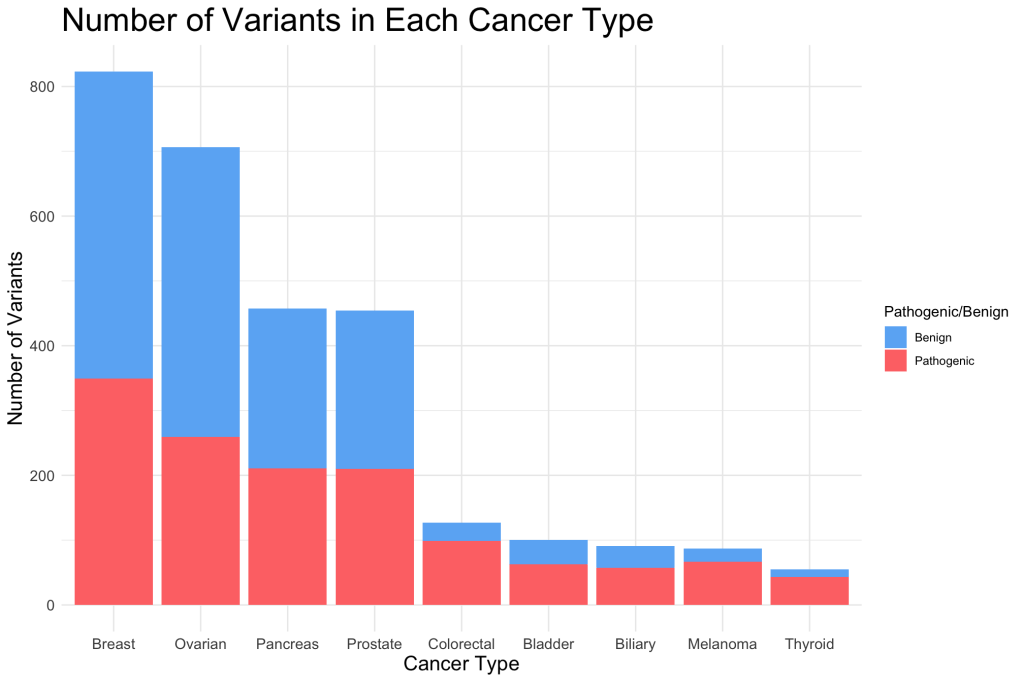
We can see from the bar plot that colorectal, bladder, biliary, melanoma, and thyroid cancers had relatively smaller sample sizes compared to the rest of the cancer types. They also had a higher imbalance between number of benign and pathogenic variants, indicating that MCC is an important metric for evaluating in silico tools when the data is stratified with these cancer types.
Results
Using the formattable package, I created a table to visualize our resulting performance metrics. Each column has a color gradient set according to the minimum and maximum values of that column. White indicates the lowest value of the column whereas the deepest green indicates the highest value of the column.
Table
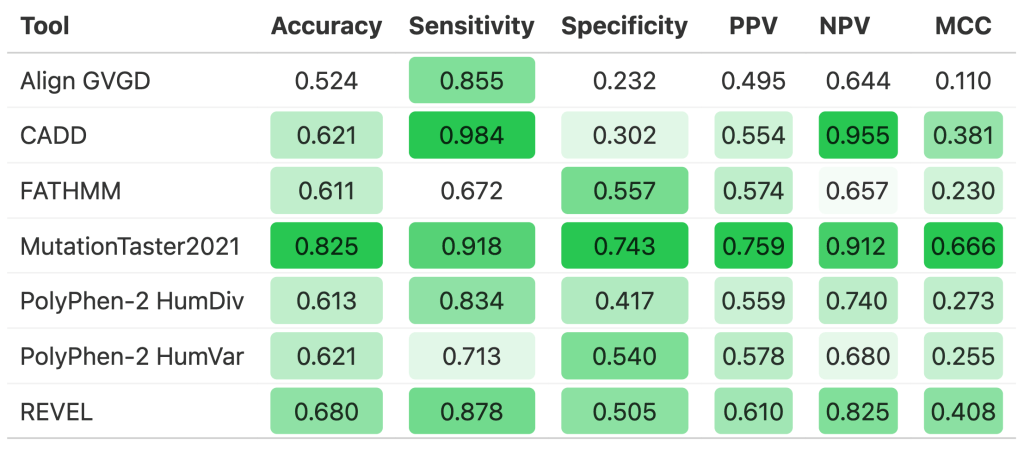
We can see from the table that MutationTaster2021 contained the all of the highest value in each metric type besides sensitivity and NPV. On the other hand, Align GVGD showed the lowest performance in all of the metrics except sensitivity. REVEL and CADD also did fairly well overall.
Radar Chart
In order to visualize the overall performance of each tool, I created a grid of radar charts using the fmsb package.
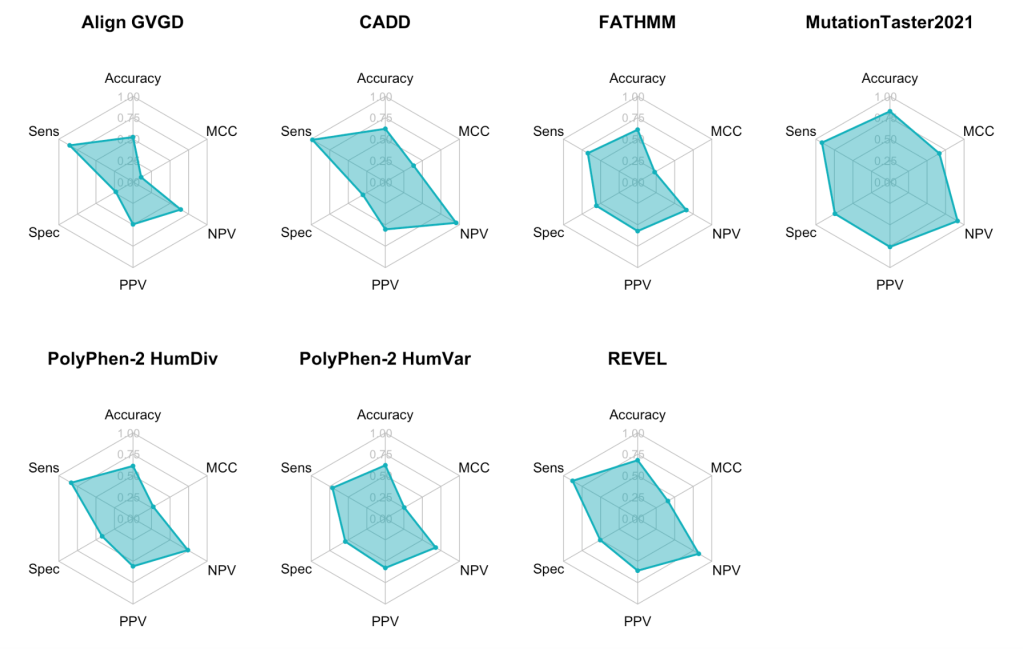
Again, we can see MutationTaster2021 performed the best whereas Align GVGD performed the worst overall. Although CADD does not perform well overall, we can see that it has a high sensitivity and NPV. Also, from the shape of each radar chart areas, it seems that MCC and specificity tend to be relatively low across all of the tools whereas sensitivity and NPV are relatively high.
Conclusion
The results show that even widely-used tools have very different performance, and limitations as a diagnostic tool. All of the in silico tools demonstrated high sensitivity and could be used to rule out pathogenic variants. However, excluding MutationTaster2021, all tools demonstrated low specificity. This indicates that only MutationTaster2021 should be used to rule in pathogenic variants. Accuracy ranged from moderate to high values across the tools. Besides MutationTaster2021, MCC were found to be especially low. MutationTaster2021 showed the highest level of performance with the highest accuracy, specificity, PPV, and MCC, and relatively high sensitivity and NPV. It even outperformed meta-predictor tools that have demonstrated high performance in previous studies. Conversely, Align-GVGD had the lowest level of performance with the lowest accuracy, specificity, PPV, NPV, and MCC. Although in silico tools can offer valuable insights into confirming the pathogenicity of VUS, clinicians should not make a decision based solely on the prediction of in silico tools.
Publication
- Yu E., Hong I., Song C., Kim E., Lee G., Lee A., Chae Y.K. (2024). Evaluation of in silico tools for variant classification in missense variants of solid cancer with actionable genetic targets. medRxiv. https://doi.org/10.1101/2024.04.22.24306182
- Song C., Yu E., Hong I., Lee G., Lee A., Cheng W., Kim E., Chae Y.K. (2022). Evaluation of in silico tools for variant classification in missense variants of solid cancer with actionable genetic targets. Cancer Research, 82(12). https://doi.org/10.1158/1538-7445.AM2022-2722
Check out my GitHub repository for more information and source code of the project!

Leave a comment