

Check out my GitHub repository for more information and source code of the project!
- Introduction/Objective
- Dataset
- Over-Representation Analysis (ORA)
- Gene Set Enrichment Analysis (GSEA)
- Conclusion
Introduction/Objective
In this project, I conducted two comparative gene expression analyses, over-representation analysis and Gene Set Enrichment Analysis, on juvenile idiopathic arthritis and inflammatory bowel disease gene fold change data to determine whether four immune system signaling pathways are over-expressed in these diseases.
The objectives of this projects are:
- Test whether adaptive and innate immune system signaling pathways are over-expressed in juvenile idiopathic arthritis (JIA) and inflammatory bowel diseases (IBD)
- Over-representation analysis (ORA)
- Gene Set Enrichment Analysis (GSEA)
- Biologically explain the statistical analysis results
- Compare results to the findings from the data source publication
- Visualize genetic expression data and analysis results
Dataset
The dataset I used is from the Gene Expression Atlas database. The data contains fold changes and the corresponding p-values between “normal” subjects and those with either Crohn disease, ulcerative colitis, oligoarticulator juvenile idiopathic arthritis (oJIA), polyarticular juvenile idiopathic arthritis (pJIA), or systemic-onset juvenile idiopathic arthritis (sJIA). Crohn disease and ulcerative colitis can be grouped as inflammatory bowel diseases (IBD) and the other three conditions are subtypes of juvenile idiopathic arthritis (JIA).
Since the publication associated with the dataset compared IBD to the three subtypes of JIA, I also created two datasets using the raw counts data from the database. The first contains data on fold change between the three subtypes of JIA and Crohn disease, while the second set contains data on fold change between the three subtypes of JIA and ulcerative colitis. In order to account for the difference in sample size between the diseases, I first normalized the raw counts data by trimmed mean of m-values (TMM) and calculated the fold changes and corresponding p-values. I also corrected the p-values (now denoted as q-values) using the Benjamini-Hochberg method to control the false discovery rate.
URL: https://www.ebi.ac.uk/gxa/experiments/E-GEOD-112057/Results
Mo A, Marigorta UM, Arafat D, Chan LHK, Ponder L, Jang SR, Prince J, Kugathasan S, Prahalad S, Gibson G. Disease-specific regulation of gene expression in a comparative analysis of juvenile idiopathic arthritis and inflammatory bowel disease. Genome Med. 2018 Jun;10(1) 48. https://doi.org/10.1186/s13073-018-0558-x.
Along with the three fold change datasets, I selected four different signaling pathways to test whether they are over-expressed in our diseases. Two of them play a role in the innate immune system (NOD-like receptor pathway and toll-like receptor pathway) and the rest play a role in the adaptive immune system (IL-17 pathway and T-cell receptor pathway).
In order the conduct the analyses, I obtained lists of genes associated with each pathway from the following sources:
- NOD-like receptor: https://www.genome.jp/entry/hsa04621
- Toll-like receptor: https://www.genome.jp/entry/hsa04620
- IL-17: https://www.genome.jp/entry/hsa04657
- T-cell receptor: https://www.genome.jp/entry/hsa04660
Over-Representation Analysis (ORA)
ORA is a statistical method used to determine whether certain genes is more prevalent than expected in a set of data. It relies on a one-tailed hypergeometric test to calculate the probability of the upregulated gene count occurring given the totally number of genes, sample size, population size (p-value). If the p-value is statistically significant, then the gene is over-represented in our data.
I tested whether the genes associated the four selected signaling pathways are enriched in our diseases compared to normal samples and also JIA compared to IBD.
Volcano Plots
The following volcano plots visualize the distribution of the fold changes against its p-value. The red dotted line is set at alpha = 0.05 and the points above the line (colored in blue) are the genes that showed statistically significant fold change.
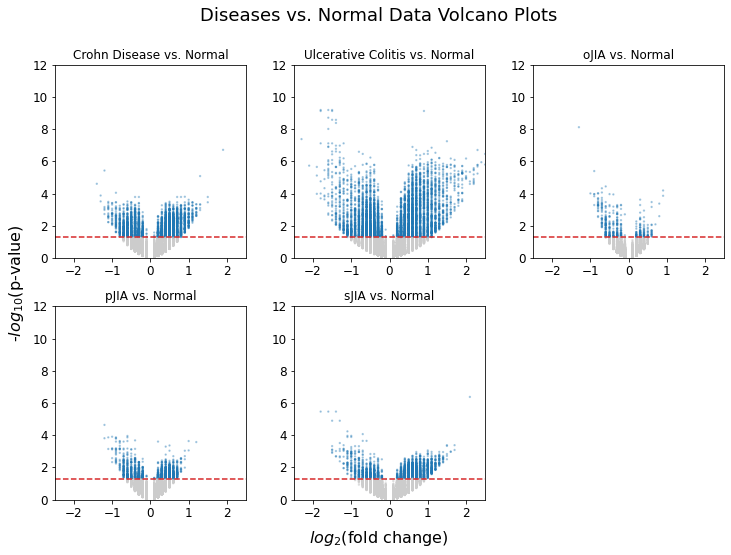
As expected, all of the diseases display a good number of genes with significant fold change compared to samples without disease. We can also see that ulcerative colitis fold change overall shows the greatest degree of statistical significance.
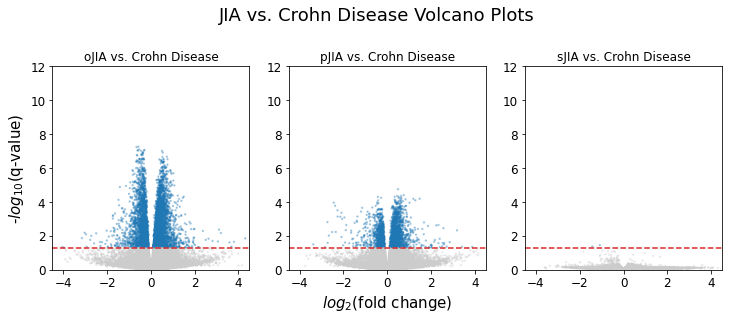
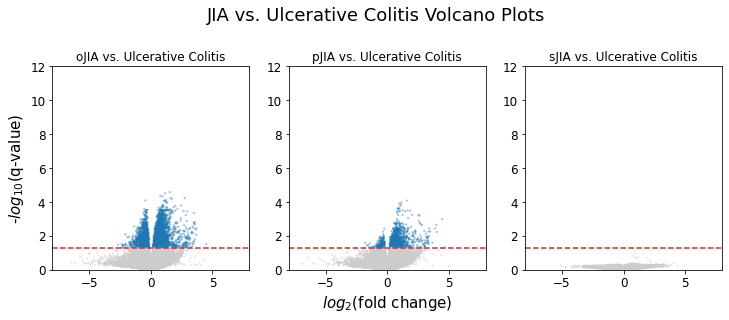
As we saw in the sJIA vs. Crohn disease and sJIA vs. ulcerative colitis volcano plots, there were no genes that showed significant fold change between sJIA and IBD (Crohn disease and ulcerative colitis). On the other hand, oJIA and pJIA showed a good amount of observations that had significant fold changes against IBD. This confirms the expectation that sJIA is most similar to IBD compared to the other JIA subtypes.
Analysis: One-Tailed Hypergeometric (Fisher’s) Test
Disease vs. Normal
The following table shows the resulting p-values from the one-tailed Fisher’s test:
| Pathway | Crohn Disease | Ulcerative Colitis | oJIA | pJIA | sJIA |
|---|---|---|---|---|---|
| Nod-like receptor | 3.628 x 10⁻¹² | 1.295 x 10⁻⁹ | 1.000 | 3.646 x 10⁻⁴ | 5.033 x 10⁻¹⁵ |
| Toll-like receptor | 1.927 x 10⁻⁷ | 1.313 x 10⁻⁶ | 1.000 | 0.045 | 8.354 x 10⁻⁷ |
| IL-17 | 2.317 x 10⁻⁵ | 3.762 x 10⁻⁵ | 1.000 | 1.994 x 10⁻³ | 7.967 x 10⁻⁷ |
| T-cell receptor | 1.404 x 10⁻⁵ | 1.064 x 10⁻⁴ | 0.545 | 0.016 | 3.814 x 10⁻⁵ |
The analysis showed some expected and unexpected results. It is known that the innate immune system is strongly involved in the pathogenesis of IBD (Crohn disease and ulcerative colitis). However, there were significant over-representations of both innate and adaptive immune system related pathways. The same goes for sJIA, which was found to be similar to IBD compared to the rest of the JIA subtypes.
The analysis with oJIA dataset did not show any significant results, most likely due to the small sample size (165). As a result, I will be excluding oJIA data from GSEA in the next section.
I expected an over-representation of adaptive immune system pathways (IL-17, T-cell receptor) in the pJIA data analysis and my expectations were met. On the other hand, there was also an innate immune system pathway that was unexpectedly over-represented in pJIA (NOD-like receptor pathway). This was highly unexpected because NOD-receptors are known to play a pivotal role in innate immunity. The toll-like receptor pathway was also over-represented in pJIA, although it just passed the alpha = 0.05 cutoff with a p-value of 0.045.
JIA vs. Crohn Disease
The following table shows the resulting p-values from the one-tailed Fisher’s test:
| Pathway | oJIA | pJIA | sJIA |
|---|---|---|---|
| Nod-like receptor | 0.992 | 0.939 | 1.000 |
| Toll-like receptor | 0.987 | 0.975 | 1.000 |
| IL-17 | 0.724 | 0.965 | 1.000 |
| T-cell receptor | 0.028 | 0.871 | 1.000 |
As expected, our pathways did not show any over-representation in sJIA compared to Crohn disease because it is the most similar JIA type to IBD. It was also expected that many of the immune system pathways are not over-represented in JIA compared to Crohn disease since they are both conditions that affect the immune system. The only statistically significant result was an over-representation of the t-cell receptor pathway in oJIA compared to Crohn disease.
JIA vs. Ulcerative Colitis
The following table shows the resulting p-values from the one-tailed Fisher’s test:
| Pathway | oJIA | pJIA | sJIA |
|---|---|---|---|
| Nod-like receptor | 1.000 | 0.795 | 1.000 |
| Toll-like receptor | 0.998 | 0.929 | 1.000 |
| IL-17 | 0.968 | 0.554 | 1.000 |
| T-cell receptor | 0.069 | 0.956 | 1.000 |
Once again, there was no pathway over-representation in sJIA compared to ulcerative colitis. We see a very similar result compared to the JIA vs. Crohn disease analysis. However, there weren’t any statistically significant over-representation, although t-cell receptor pathway in oJIA came close at p-value = 0.069.
Gene Set Enrichment Analysis (GSEA)
GSEA is another method of testing whether a certain gene (or pathway of genes) is comparatively upregulated in a set condition. We can use the fold change data to calculate the enrichment score (ES) and use random gene permutation to determine the statistical significance of the ES. Using the gene permutation, we can also calculate the normalized enrichment score (NES) for each gene, which allows us to compare enrichment levels between different genes.
The primary difference between GSEA and ORA is that ORA is focused on the overlap of genes in different datasets whereas GSEA looks at the gene expression change distribution to determine over-representation. Therefore, an advantage that GSEA has over ORA is that it can detect pathway upregulation even if the associated genes are not over-represented as long as the entire pathway is over-represented to some degree.
Inflammatory Bowel Diseases (Crohn Disease and Ulcerative Colitis)
For this analysis, I decided to combine Crohn disease and ulcerative disease data into one IBD data. I filtered out genes that had fold change p-value < 0.05 for both diseases and averaged the fold change values.
The following figure shows the running enrichment score, fold change, and pathway gene barcode for each signaling pathway:
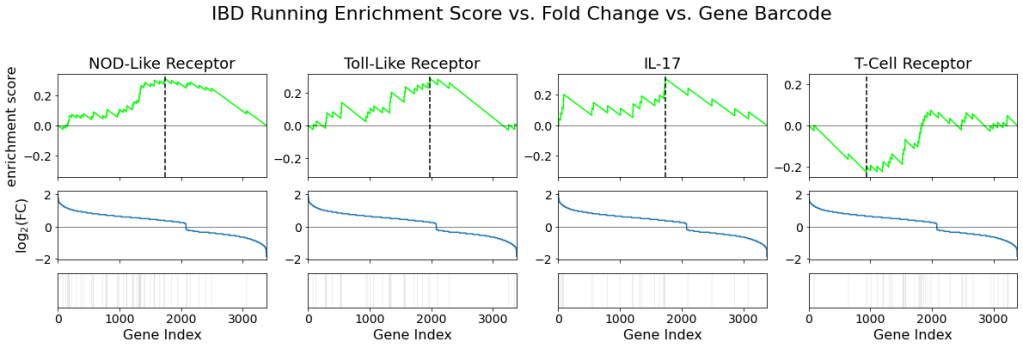
The barcode on the bottom row of the plot grid highlights the genes in each corresponding pathway. The black lines represent the index of genes associated with the signaling pathway. The middle row plots the fold change against the gene index. Positive fold change indicates upregulation and by comparing the middle and bottom plots, we can see that most of the pathways in the NOD-like receptor, toll-like receptor, and IL-17 pathways are upregulated. On the other hand, it appears that there are more genes in the t-cell receptors that were downregulated compared to the other pathways.
The top row of plots shows the running enrichment score vs. gene index for each pathway. It allows us to identify the Enrichment Score (ES) of the pathway, which is the point at which our running enrichment score reaches its highest deviation from zero. A positive ES indicates that the pathway is upregulated, although we cannot determine the statistical significance yet. We can see that the first three pathways’ ES are positive whereas T-cell receptor pathway has a negative ES.
To determine the statistical significance of the ES, I performed a random gene permutation in which I scrambled the set of genes in our pathways and calculated the ES for each of the 10,000 permutations. Then I plotted the null ES distribution. The red line indicates the true ES determined above.
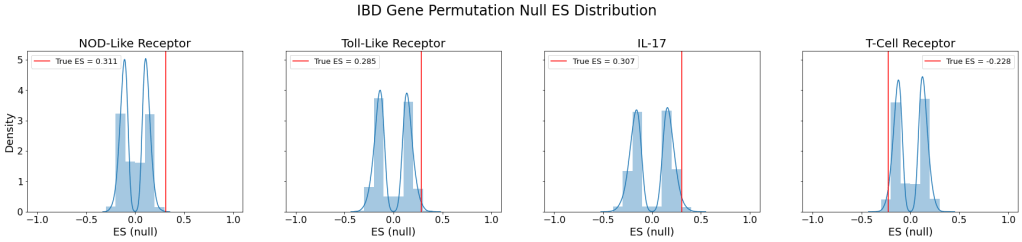
| Pathway | Empirical p-value | Normalized Enrichment Score |
|---|---|---|
| Nod-like receptor | 0.000 | 2.586 |
| Toll-like receptor | 0.014 | 1.860 |
| IL-17 | 0.029 | 1.712 |
| T-cell receptor | 1.000 | -1.649 |
The resulting empirical p-values indicate that NOD-like receptor, toll-like receptor, and IL-17 pathways were indeed upregulated to a statistically significant degree in IBD patients compared to those without the disease.
This result was both expected and unexpected. Since the innate immune system is known to be over-expressed in IBD patients, it was expected that NOD-like receptor and toll-like receptor pathways would be upregulated. However, IL-17 pathway, involved in the adaptive immune system, also showed significant upregulation.
Polyarticular Juvenile Idiopathic Arthritis (pJIA)
The following figure shows the running enrichment score, fold change, and pathway gene barcode for each signaling pathway:
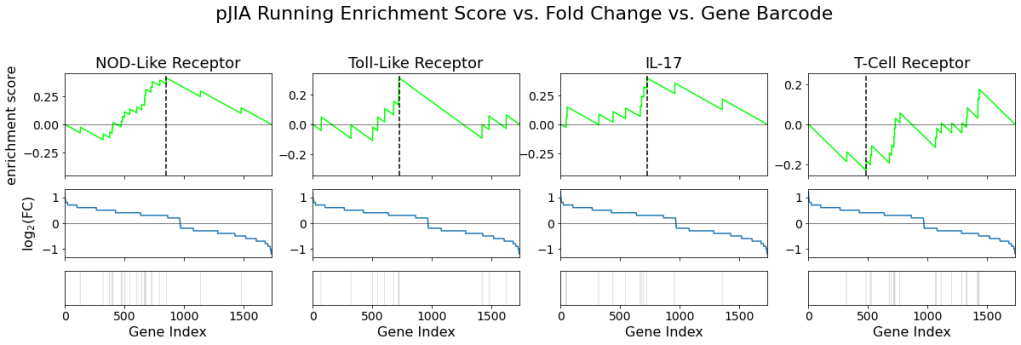
Similar to the result from IBD’s analysis, we can see many of the genes in the first three pathways are upregulated where as there seems to be comparatively less upregulated genes in the T-cell receptor pathway. The ES also indicates that the first three pathways are upregulated and the T-cell receptor pathway is downregulated.
The following figure shows the null ES distribution from the random gene permutation along with the true ES plotted as a red line for each signaling pathway:
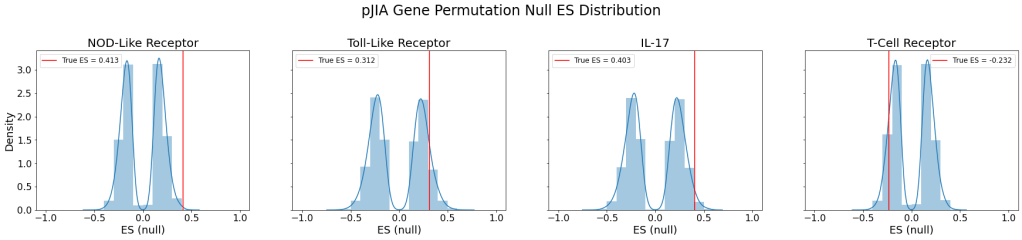
| Pathway | Empirical p-value | Normalized Enrichment Score |
|---|---|---|
| Nod-like receptor | 0.001 | 2.190 |
| Toll-like receptor | 0.191 | 1.254 |
| IL-17 | 0.037 | 1.629 |
| T-cell receptor | 1.000 | -1.251 |
The resulting empirical p-values indicate that NOD-like receptor and IL-17 pathways were indeed upregulated to a statistically significant degree in pJIA patients compared to those without the disease. However, although IL-17 pathway’s ES was positive (indicating upregulation), it was not found to be statistically significant.
The GSEA on the pJIA vs. normal dataset showed some very unexpected results. First, similar to ORA, I saw an overexpression of the NOD-like receptor pathway, which goes against the expectation that pJIA involves adaptive immunity. Also, although T-cell receptor pathway is involved in the adaptive immune system, there wasn’t an overexpression of the pathway. In fact, there seems to be an underexpression of the pathway, which also goes against the findings from ORA.
Systemic-onset Juvenile Idiopathic Arthritis (sJIA)
The following figure shows the running enrichment score, fold change, and pathway gene barcode for each signaling pathway:
We again see very similar results from IBD and pJIA.
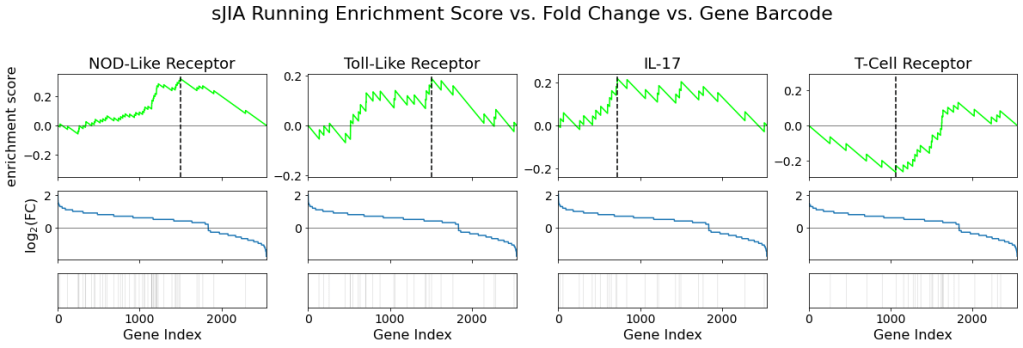
The following figure shows the null ES distribution from the random gene permutation along with the true ES plotted as a red line for each signaling pathway:
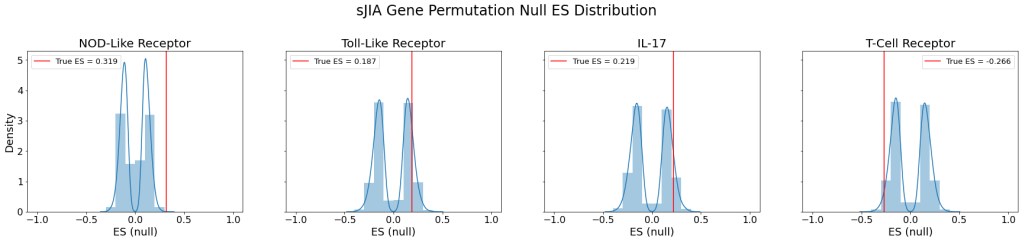
| Pathway | Empirical p-value | Normalized Enrichment Score |
|---|---|---|
| Nod-like receptor | 0.000 | 2.650 |
| Toll-like receptor | 0.270 | 1.153 |
| IL-17 | 0.171 | 1.285 |
| T-cell receptor | 1.000 | -1.616 |
The resulting empirical p-values indicate that NOD-like receptor pathway was upregulated to a statistically significant degree in sJIA patients compared to those without the disease.
As expected, the GSEA on sJIA vs. normal data showed a lack of statistically significant over-expression of the adaptive immune system pathways. However, although NOD-like receptor was upregulated, the other innate immune system pathway, toll-like receptor pathway, was not significantly upregulated.
Conclusion
Mo et al. paper concluded that the innate immune system is strongly involved in the pathogenesis of IBD and the adaptive immune system is strongly involved in JIA. They also concluded that sJIA is the most similar to IBD compared to the other types of JIA. Therefore, I expected to see an upregulation of the NOD-like receptor and toll-like receptor pathways in Crohn disease, ulcerative colitis, and SJIA. I also expected to see an upregulation of the IL-17 and T-cell receptor pathways in oJIA and pJIA. Since oJIA’s sample size was too small, we were not able to make any conclusions in either analyses.
There was a mix of expected and unexpected results. ORA indicated that all four signaling pathways are upregulated in IBD, sJIA, and pJIA. On the other hand, GSEA found that T-cell receptor pathway is not upregulated in any of the diseases whereas NOD-like receptor pathway is upregulated in all of the diseases.
Check out my GitHub repository for more information and source code of the project!

Leave a comment